Current Pulse
Composite Phase
1.12
Valuation Pressure
1.50
Liquidity Trigger
-0.12
Data Coverage
2026-02-28
Indicator Dashboard
| Z-score | Latest_value | Weight | Contribution | Last_date | |
|---|---|---|---|---|---|
| Buffett_ratio | 2.66 | 214.16 | 0.27 | 0.73 | 2026-01-31 |
| CAPE | 1.85 | 39.51 | 0.27 | 0.51 | 2025-10-01 |
| CI_Loans_YoY | -0.01 | 4.47 | 0.20 | -0.00 | 2026-02-28 |
| M2_YoY | -0.33 | 4.22 | -0.23 | 0.07 | 2026-02-02 |
| FedBalanceSheet_YoY | -0.52 | -2.25 | -0.18 | 0.09 | 2026-03-04 |
| RRP_YoY | 0.00 | 0.00 | 0.14 | 0.00 | 2026-03-04 |
| HY_Spread | -0.77 | 2.91 | 0.22 | -0.17 | 2026-03-03 |
| IG_Spread | -0.83 | 1.69 | 0.11 | -0.09 | 2026-03-03 |
| VIX | 0.03 | 19.86 | -0.16 | -0.00 | 2026-03-17 |
| VolTerm | -0.08 | 0.91 | 0.22 | -0.02 | 2026-03-17 |
Historical Backdrop
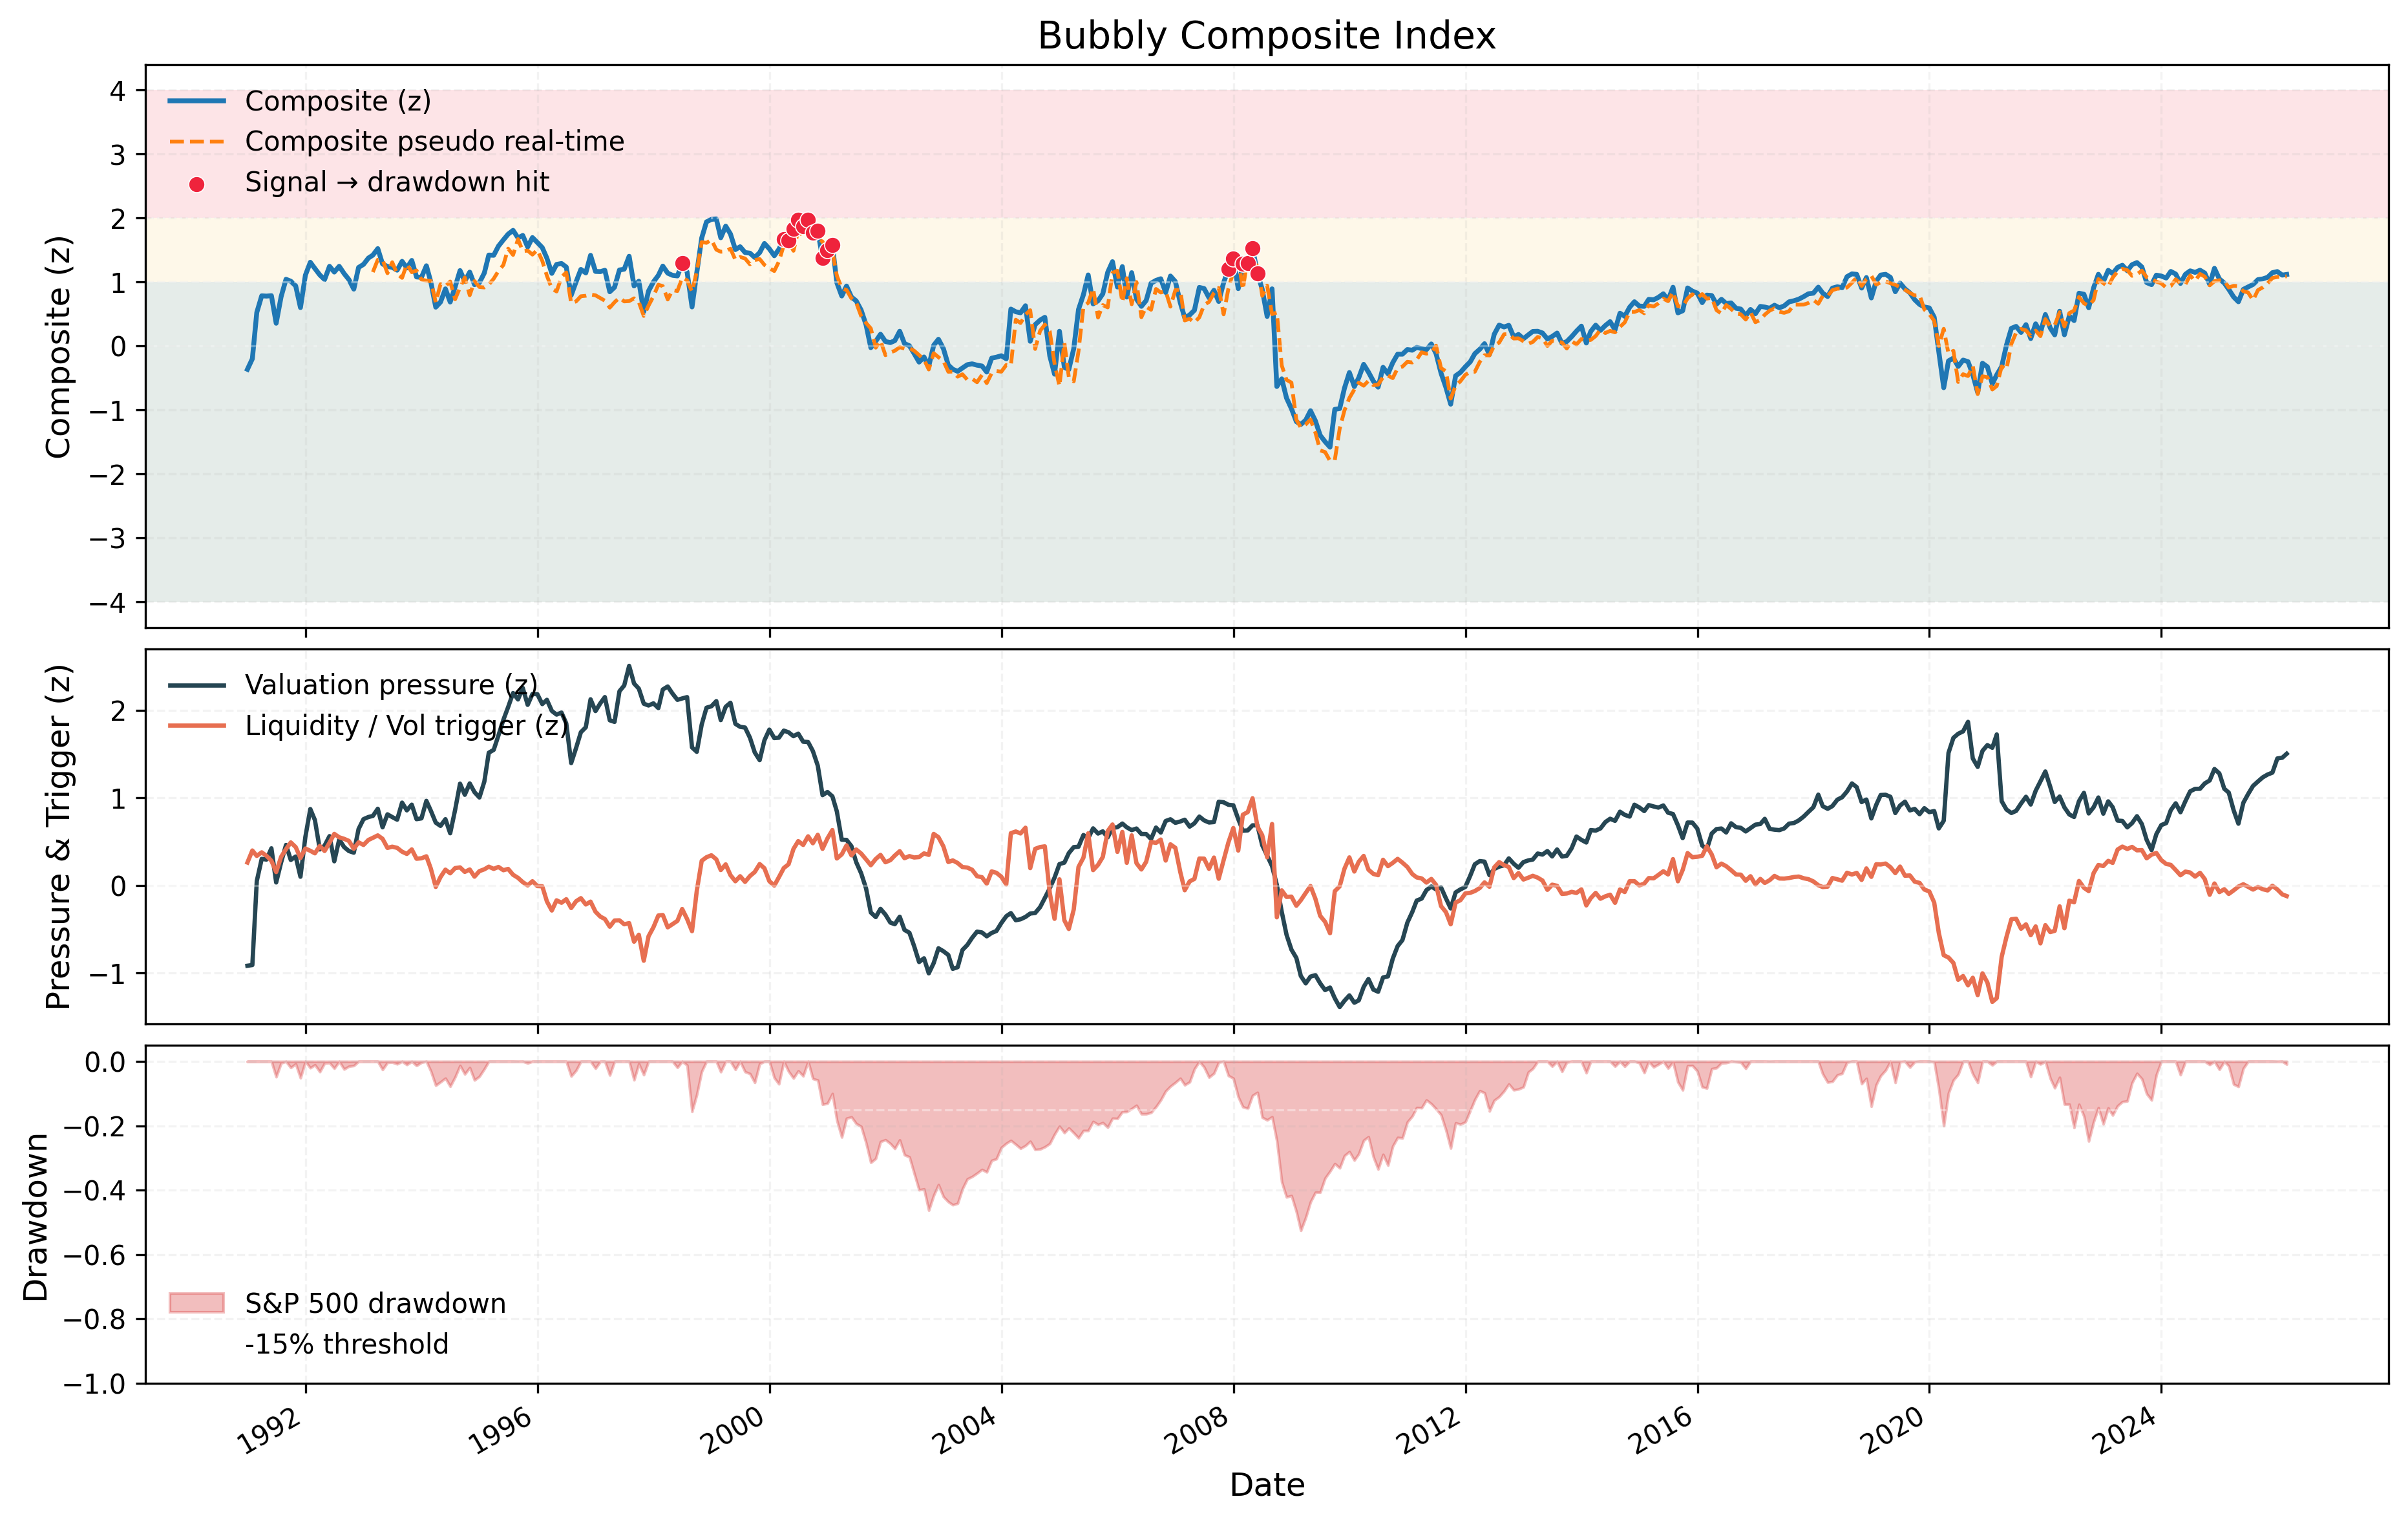
Validation Signals
| horizon_months | signals | hits | hit_rate | avg_hit_lead_months | median_drawdown | worst_drawdown |
|---|---|---|---|---|---|---|
| 6 | 148 | 7 | 0.047 | 4.286 | -0.012 | -0.360 |
| 12 | 148 | 18 | 0.122 | 7.333 | -0.017 | -0.475 |
Data Freshness
| Indicator | Last Update |
|---|---|
| CAPE | 2025-10-01 |
| Buffett_ratio | 2026-01-31 |
| M2_YoY | 2026-02-02 |
| CI_Loans_YoY | 2026-02-28 |
| HY_Spread | 2026-03-03 |
| IG_Spread | 2026-03-03 |
| FedBalanceSheet_YoY | 2026-03-04 |
| RRP_YoY | 2026-03-04 |
| VIX | 2026-03-17 |
| VolTerm | 2026-03-17 |